InsideSPX Momentum
Each month, screen the top-100 S&P 500 members and buy 1-month at-the-money calls on every member whose prior-month return was positive. Call premiums tie up only ~1.3% of capital on average; the rest sits in cash earning the effective Fed Funds rate. The strategy exploits short-term momentum through the most efficient part of the vol surface — near-the-money short-dated calls where skew is minimal and liquidity is deep.
How It Works
Four mechanical steps, run at the close of every month with no discretion.
Top-100 SPX Members
From the S&P 500, only the largest 100 members by market cap are eligible — updated year by year to reflect the actual index composition at each point in time. This keeps the universe liquid, optionable, and free of backfill bias.
1-Month Price Momentum
Any member whose prior-month return was positive receives a buy signal. Equal weight is applied across all signal-positive names each month — typically ~60 concurrent positions (range 2–94), providing broad diversification within the momentum cohort.
ATM Calls — Best of the Vol Curve
Rather than holding stock, the strategy buys 1-month at-the-money calls on each name. Near-the-money options sit at the sweetest point of the volatility surface: skew is minimal (unlike OTM puts, which carry a large premium), bid-ask spreads are tightest, and the instrument delivers convex, asymmetric payoff — full upside participation with the downside floored at the premium paid.
Uniform 1× — Cash Earns Fed Funds
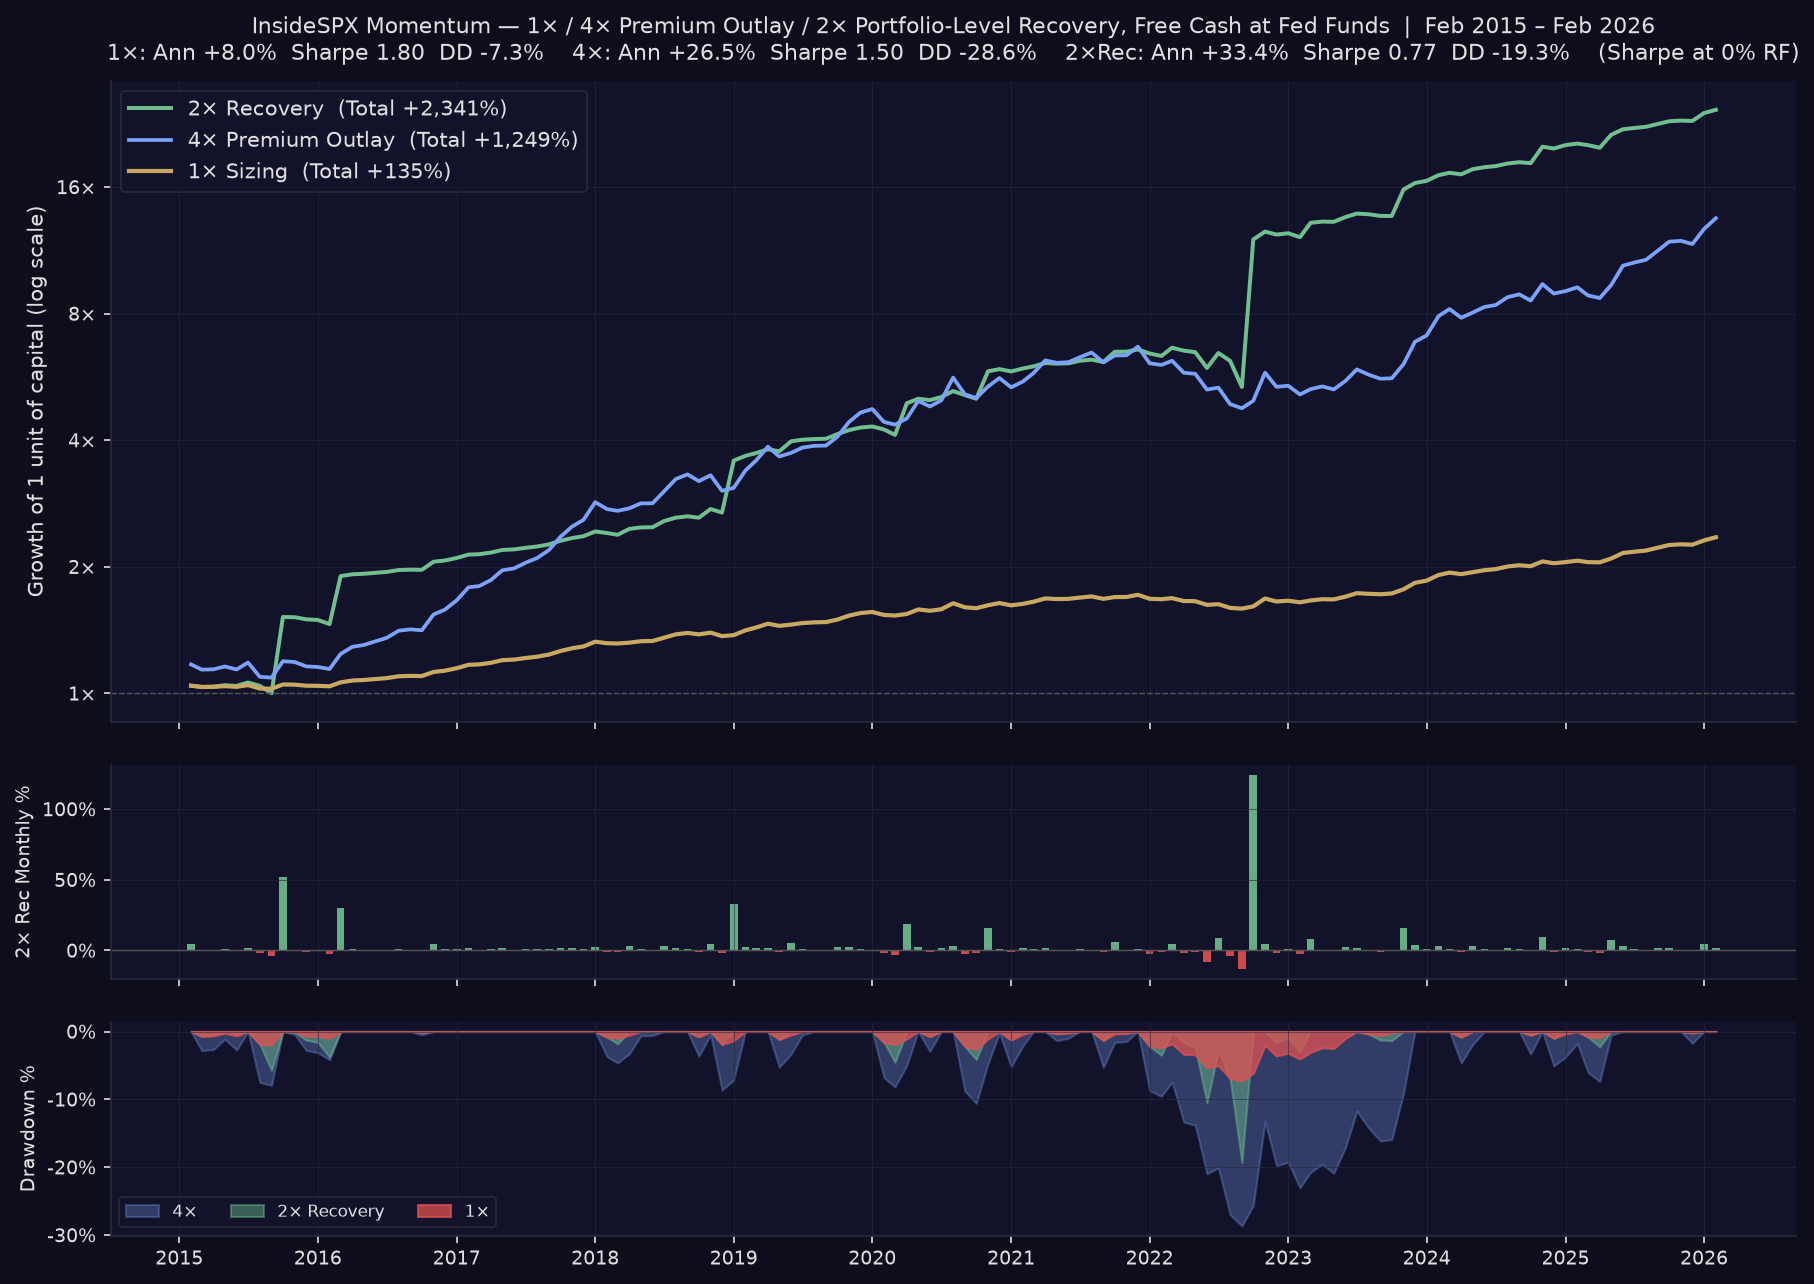
Every signal-positive name gets the same one-unit premium outlay — no recovery scaling, no martingale. Premiums average just 1.3% of capital, so ~98.7% sits in cash earning the effective Fed Funds rate. A 4× premium-outlay variant quadruples exposure while ~95% of capital still stays in cash — the leverage is embedded in the options, nothing is borrowed. A third simulated variant (2× Recovery, shown in the table) doubles the outlay after losing months until the drawdown is recovered.
Simulated Performance
Backtest Feb 2015 – Feb 2026 (133 months). Premiums before Sep 2020 scaled by realised VIX ratio to avoid vol-environment bias.
| Metric | 1× Sizing | 4× Premium Outlay | 2× Recovery |
|---|---|---|---|
| Total Return (compound, 133 mo.) | +135.1% | +1249.0% | +2341.4% |
| Ann. Return | +8.0% | +26.5% | +33.4% |
| Ann. Volatility | 4.5% | 17.7% | 43.5% |
| Sharpe (0% RF) | 1.80 | 1.50 | 0.77 |
| Sortino (0% RF) | 3.40 | 2.82 | 4.10 |
| Calmar Ratio | 1.10 | 0.92 | 1.73 |
| Max Drawdown | −7.3% | −28.6% | −19.3% |
| Win Rate (months) | 69.9% | 69.9% | 69.2% |
| Best Month | +4.4% | +17.2% | +124.2% |
| Worst Month | −2.2% | −8.8% | −13.3% |
| VaR 95% | −1.6% | −7.1% | −2.2% |
| CVaR 95% | −2.0% | −8.2% | −5.3% |
| Capital in Options (avg premium / portfolio) | 1.3% | 5.3% | 3.0% avg (peak 41%) |
| Free Cash (earning MMR) | ~98.7% | ~94.7% | ~97.0% avg |
Free cash earns the effective Fed Funds rate each month. The 4× version spends 4× the call premiums out of the same equity — options embed the leverage, so nothing is borrowed and no interest is paid; free cash (capital minus premiums) also earns FFR. Sharpe/Sortino above use a 0% risk-free rate; measured as excess over FFR instead, Sharpe is 1.34 (1×) and 1.38 (4×). Capital in Options = avg call premiums as % of portfolio (1% stock weight × avg ~1.3% premium per stock). The 2× Recovery column re-adds portfolio-level recovery sizing: after any losing month the per-name premium outlay is scaled so its expected payoff covers the cumulative loss, then doubled, until the drawdown is recovered (sizes reach 126× base; premiums peak at 41% of capital, so no borrowing is needed). Its free cash also earns FFR. Months from Jan 2025 extend the original backtest walk-forward: prices from monthly adjusted closes; premiums from the live options dataset where available (through Feb 2026), otherwise the ticker's or its sector proxy's average recorded premium; FI and MMC lack price data and are excluded in the extension window.
Monthly Archive
Every month since inception — 1× and 4× return, capital in options, bets placed, wins, and top contributor.
| Month | 1× Ret | 4× Ret | Rec Ret | Cap In | Bets | W/B | Top Pick |
|---|---|---|---|---|---|---|---|
| 2026-02 | +1.74% | +6.07% | +1.74% | 1.92% | 57 | 35/57 | GEV (+0.17%) |
| 2026-01 | +2.38% | +8.63% | +4.47% | 1.84% | 57 | 28/57 | MU (+0.83%) |
| 2025-12 | -0.20% | -1.73% | -0.20% | 1.38% | 51 | 12/51 | MU (+0.17%) |
| 2025-11 | +0.35% | +0.44% | +0.35% | 1.79% | 50 | 19/50 | LLY (+0.22%) |
| 2025-10 | +1.52% | +5.05% | +1.52% | 1.69% | 51 | 24/51 | MU (+0.28%) |
| 2025-09 | +1.55% | +5.13% | +1.55% | 1.85% | 62 | 24/62 | MU (+0.37%) |
| 2025-08 | +0.65% | +1.52% | +0.65% | 1.40% | 50 | 22/50 | LOW (+0.13%) |
| 2025-07 | +0.71% | +1.74% | +0.71% | 2.24% | 70 | 27/70 | AMD (+0.21%) |
| 2025-06 | +3.07% | +11.21% | +3.07% | 2.36% | 74 | 44/74 | ORCL (+0.29%) |
| 2025-05 | +2.11% | +7.36% | +7.36% | 1.48% | 46 | 30/46 | AVGO (+0.82%) |
| 2025-04 | -0.09% | -1.44% | -1.44% | 0.65% | 21 | 2/21 | PM (+0.23%) |
| 2025-03 | -0.82% | -4.35% | -0.82% | 1.63% | 53 | 9/53 | MDLZ (+0.04%) |
| 2025-02 | +0.79% | +2.08% | +0.79% | 2.15% | 70 | 27/70 | PM (+0.17%) |
| 2025-01 | +0.62% | +1.40% | +1.91% | 0.51% | 15 | 9/15 | META (+0.81%) |
| 2024-12 | -0.99% | -5.09% | -0.99% | 1.92% | 70 | 5/70 | BA (+0.11%) |
| 2024-11 | +2.65% | +9.44% | +9.44% | 0.89% | 37 | 29/37 | MCK (+0.90%) |
| 2024-10 | -0.53% | -3.33% | -0.53% | 2.01% | 64 | 13/64 | MS (+0.09%) |
| 2024-09 | +0.71% | +1.55% | +0.71% | 2.13% | 76 | 32/76 | ORCL (+0.18%) |
| 2024-08 | +1.43% | +4.38% | +1.43% | 1.44% | 60 | 36/60 | SBUX (+0.20%) |
| 2024-07 | +0.61% | +1.09% | +0.61% | 1.86% | 58 | 24/58 | BMY (+0.12%) |
| 2024-06 | +1.12% | +3.14% | +1.12% | 1.96% | 72 | 29/72 | ORCL (+0.16%) |
| 2024-05 | +1.04% | +2.83% | +2.83% | 0.64% | 29 | 18/29 | NEE (+0.73%) |
| 2024-04 | -0.83% | -4.65% | -0.83% | 2.05% | 69 | 9/69 | GE (+0.13%) |
| 2024-03 | +1.33% | +3.99% | +1.33% | 1.83% | 70 | 37/70 | MU (+0.23%) |
| 2024-02 | +3.10% | +11.08% | +3.10% | 1.80% | 65 | 44/65 | META (+0.22%) |
| 2024-01 | +1.23% | +3.59% | +1.23% | 2.14% | 81 | 36/81 | NVDA (+0.21%) |
| 2023-12 | +3.59% | +13.01% | +3.59% | 1.77% | 82 | 62/82 | AVGO (+0.18%) |
| 2023-11 | +2.34% | +8.04% | +15.64% | 0.70% | 35 | 27/35 | INTC (+1.52%) |
| 2023-10 | +0.40% | +0.27% | -0.07% | 0.38% | 16 | 6/16 | HUM (+0.72%) |
| 2023-09 | -0.23% | -2.24% | -0.90% | 0.87% | 38 | 3/38 | XOM (+0.09%) |
| 2023-08 | -0.37% | -2.81% | -0.37% | 1.75% | 70 | 14/70 | CSCO (+0.09%) |
| 2023-07 | +1.94% | +6.46% | +1.94% | 2.30% | 88 | 51/88 | SCHW (+0.14%) |
| 2023-06 | +1.52% | +4.82% | +2.62% | 0.83% | 28 | 24/28 | ADBE (+0.30%) |
| 2023-05 | -0.10% | -1.67% | -0.10% | 1.40% | 61 | 10/61 | GOOGL (+0.12%) |
| 2023-04 | +0.68% | +1.51% | +0.68% | 1.99% | 75 | 31/75 | ISRG (+0.17%) |
| 2023-03 | +1.04% | +2.99% | +8.18% | 0.76% | 20 | 14/20 | META (+1.99%) |
| 2023-02 | -0.88% | -4.68% | -2.15% | 1.95% | 67 | 8/67 | META (+0.25%) |
| 2023-01 | +0.42% | +0.61% | +0.73% | 0.67% | 23 | 9/23 | META (+1.04%) |
| 2022-12 | -1.62% | -7.49% | -1.62% | 2.51% | 85 | 7/85 | SO (+0.05%) |
| 2022-11 | +4.40% | +16.67% | +4.40% | 2.46% | 84 | 64/84 | BA (+0.23%) |
| 2022-10 | +1.24% | +4.19% | +124.22% | 0.33% | 11 | 11/11 | NFLX (+23.91%) |
| 2022-09 | -0.40% | -2.24% | -13.28% | 0.66% | 21 | 1/21 | VRTX (+0.11%) |
| 2022-08 | -2.01% | -8.64% | -4.22% | 2.65% | 80 | 6/80 | PYPL (+0.11%) |
| 2022-07 | +0.37% | +1.07% | +8.53% | 0.64% | 16 | 10/16 | BA (+4.87%) |
| 2022-06 | -2.00% | -8.29% | -8.29% | 2.29% | 57 | 2/57 | LLY (+0.06%) |
| 2022-05 | -0.09% | -0.54% | -0.84% | 0.68% | 21 | 7/21 | T (+0.63%) |
| 2022-04 | -1.57% | -6.37% | -1.57% | 1.98% | 58 | 5/58 | MRK (+0.07%) |
| 2022-03 | +0.59% | +2.32% | +4.62% | 0.92% | 30 | 16/30 | LLY (+0.92%) |
| 2022-02 | -0.22% | -0.90% | -1.35% | 0.97% | 30 | 7/30 | RTX (+0.61%) |
| 2022-01 | -2.18% | -8.73% | -2.18% | 3.50% | 81 | 14/81 | WFC (+0.08%) |
| 2021-12 | +1.21% | +4.84% | +1.21% | 1.05% | 34 | 22/34 | AVGO (+0.17%) |
| 2021-11 | +0.04% | +0.14% | +0.04% | 1.97% | 74 | 18/74 | QCOM (+0.31%) |
| 2021-10 | +0.97% | +3.87% | +5.80% | 0.55% | 16 | 10/16 | TSLA (+2.24%) |
| 2021-09 | -1.32% | -5.28% | -1.32% | 1.58% | 64 | 5/64 | NFLX (+0.05%) |
| 2021-08 | +0.65% | +2.58% | +0.65% | 1.44% | 60 | 33/60 | CHTR (+0.08%) |
| 2021-07 | +0.70% | +2.76% | +1.38% | 1.66% | 54 | 33/54 | AMD (+0.17%) |
| 2021-06 | +0.09% | +0.36% | +0.18% | 1.45% | 57 | 16/57 | NVDA (+0.39%) |
| 2021-05 | -0.33% | -1.35% | -0.33% | 1.99% | 75 | 28/75 | CVS (+0.12%) |
| 2021-04 | +1.81% | +7.21% | +1.81% | 2.38% | 81 | 55/81 | UPS (+0.16%) |
| 2021-03 | +1.19% | +4.74% | +1.19% | 1.63% | 56 | 31/56 | BA (+0.17%) |
| 2021-02 | +0.82% | +3.25% | +1.63% | 1.28% | 34 | 12/34 | AMAT (+0.34%) |
| 2021-01 | -1.24% | -4.99% | -1.24% | 2.70% | 73 | 16/73 | LLY (+0.20%) |
| 2020-12 | +1.20% | +4.79% | +1.20% | 3.03% | 92 | 45/92 | DIS (+0.19%) |
| 2020-11 | +1.63% | +6.49% | +16.21% | 1.03% | 23 | 19/23 | MU (+2.13%) |
| 2020-10 | -0.49% | -1.99% | -1.99% | 1.21% | 32 | 8/32 | ADP (+0.41%) |
| 2020-09 | -2.19% | -8.77% | -2.19% | 2.96% | 78 | 8/78 | NKE (+0.08%) |
| 2020-08 | +3.33% | +13.29% | +3.33% | 2.17% | 74 | 59/74 | CRM (+0.36%) |
| 2020-07 | +0.85% | +3.38% | +1.70% | 1.30% | 43 | 23/43 | AAPL (+0.27%) |
| 2020-06 | -0.73% | -2.94% | -0.73% | 2.58% | 74 | 18/74 | BA (+0.22%) |
| 2020-05 | +2.51% | +10.03% | +2.51% | 2.94% | 94 | 52/94 | PYPL (+0.23%) |
| 2020-04 | +0.86% | +3.44% | +18.92% | 0.47% | 12 | 11/12 | AMZN (+4.83%) |
| 2020-03 | -0.32% | -1.45% | -2.96% | 0.57% | 8 | 2/8 | REGN (+0.33%) |
| 2020-02 | -1.61% | -6.83% | -1.61% | 2.09% | 47 | 3/47 | TMUS (+0.09%) |
| 2020-01 | +0.58% | +1.92% | +0.58% | 1.60% | 76 | 32/76 | NEE (+0.09%) |
| 2019-12 | +1.40% | +5.23% | +1.40% | 1.23% | 77 | 50/77 | EOG (+0.16%) |
| 2019-11 | +2.22% | +8.48% | +2.22% | 1.04% | 72 | 50/72 | CVS (+0.13%) |
| 2019-10 | +1.36% | +5.00% | +2.57% | 0.86% | 58 | 35/58 | NVDA (+0.26%) |
| 2019-09 | +0.16% | +0.12% | +0.16% | 0.81% | 47 | 15/47 | ABBV (+0.13%) |
| 2019-08 | +0.38% | +0.98% | +0.38% | 1.40% | 65 | 24/65 | CME (+0.10%) |
| 2019-07 | +0.88% | +2.94% | +0.88% | 1.64% | 90 | 39/90 | MU (+0.13%) |
| 2019-06 | +0.65% | +2.01% | +5.64% | 0.26% | 17 | 12/17 | T (+0.94%) |
| 2019-05 | -1.17% | -5.26% | -1.17% | 1.51% | 71 | 2/71 | CME (+0.05%) |
| 2019-04 | +2.11% | +7.85% | +2.11% | 1.00% | 68 | 40/68 | QCOM (+0.51%) |
| 2019-03 | +1.55% | +5.59% | +1.55% | 1.21% | 78 | 48/78 | NVDA (+0.14%) |
| 2019-02 | +2.66% | +10.03% | +2.66% | 1.47% | 88 | 65/88 | EL (+0.13%) |
| 2019-01 | +0.56% | +1.65% | +32.91% | 0.05% | 2 | 2/2 | GE (+29.13%) |
| 2018-12 | -1.91% | -8.20% | -1.91% | 2.16% | 77 | 1/77 | AVGO (+0.03%) |
| 2018-11 | +0.96% | +3.29% | +4.85% | 0.40% | 23 | 18/23 | SBUX (+0.79%) |
| 2018-10 | -0.78% | -3.65% | -0.78% | 1.45% | 62 | 8/62 | PM (+0.08%) |
| 2018-09 | +0.79% | +2.65% | +0.79% | 0.89% | 65 | 36/65 | ABT (+0.09%) |
| 2018-08 | +1.87% | +7.01% | +1.87% | 1.13% | 80 | 44/80 | AAPL (+0.18%) |
| 2018-07 | +1.79% | +6.67% | +3.41% | 0.78% | 56 | 40/56 | LLY (+0.28%) |
| 2018-06 | +0.12% | +0.04% | +0.12% | 1.06% | 54 | 19/54 | NKE (+0.09%) |
| 2018-05 | +0.79% | +2.74% | +0.79% | 0.90% | 53 | 24/53 | GM (+0.14%) |
| 2018-04 | +0.45% | +1.40% | +3.28% | 0.46% | 26 | 14/26 | EOG (+1.03%) |
| 2018-03 | -0.15% | -0.97% | -0.97% | 0.49% | 20 | 5/20 | INTC (+0.13%) |
| 2018-02 | -0.84% | -3.70% | -0.84% | 1.85% | 81 | 13/81 | MU (+0.08%) |
| 2018-01 | +2.62% | +10.14% | +2.62% | 0.77% | 52 | 41/52 | NFLX (+0.39%) |
| 2017-12 | +1.02% | +3.75% | +1.02% | 0.89% | 74 | 38/74 | LOW (+0.10%) |
| 2017-11 | +1.53% | +5.85% | +1.53% | 0.86% | 68 | 45/68 | ELV (+0.11%) |
| 2017-10 | +1.94% | +7.46% | +1.94% | 0.74% | 64 | 44/64 | INTC (+0.18%) |
| 2017-09 | +1.18% | +4.43% | +1.18% | 0.54% | 50 | 29/50 | ABBV (+0.17%) |
| 2017-08 | +0.74% | +2.68% | +0.74% | 0.81% | 68 | 34/68 | AAPL (+0.09%) |
| 2017-07 | +0.85% | +3.11% | +0.85% | 0.54% | 47 | 24/47 | BA (+0.21%) |
| 2017-06 | +0.32% | +1.03% | +0.32% | 0.74% | 60 | 19/60 | FDX (+0.11%) |
| 2017-05 | +1.43% | +5.49% | +1.43% | 0.68% | 59 | 40/59 | AMAT (+0.11%) |
| 2017-04 | +0.90% | +3.36% | +0.90% | 0.68% | 54 | 32/54 | PYPL (+0.10%) |
| 2017-03 | +0.21% | +0.66% | +0.21% | 1.06% | 78 | 29/78 | LOW (+0.09%) |
| 2017-02 | +1.88% | +7.36% | +1.88% | 1.01% | 69 | 50/69 | PM (+0.13%) |
| 2017-01 | +1.35% | +5.24% | +1.35% | 0.91% | 69 | 39/69 | NFLX (+0.12%) |
| 2016-12 | +0.71% | +2.70% | +0.71% | 0.85% | 55 | 34/55 | T (+0.08%) |
| 2016-11 | +2.29% | +9.04% | +4.54% | 0.59% | 40 | 22/40 | BAC (+0.53%) |
| 2016-10 | -0.10% | -0.50% | -0.10% | 0.87% | 45 | 8/45 | NFLX (+0.24%) |
| 2016-09 | +0.21% | +0.73% | +0.21% | 0.70% | 46 | 16/46 | EOG (+0.08%) |
| 2016-08 | +1.01% | +3.95% | +1.01% | 1.05% | 70 | 28/70 | DHR (+0.54%) |
| 2016-07 | +0.51% | +1.93% | +0.51% | 0.57% | 46 | 24/46 | TXN (+0.09%) |
| 2016-06 | +0.54% | +2.06% | +0.54% | 1.01% | 58 | 25/58 | GIS (+0.12%) |
| 2016-05 | +0.28% | +1.01% | +0.28% | 0.92% | 60 | 23/60 | CRM (+0.08%) |
| 2016-04 | +1.02% | +3.98% | +1.02% | 1.53% | 89 | 43/89 | BMY (+0.12%) |
| 2016-03 | +2.17% | +8.60% | +30.02% | 0.60% | 39 | 35/39 | FDX (+2.42%) |
| 2016-02 | -0.25% | -1.09% | -2.21% | 0.43% | 22 | 3/22 | T (+0.16%) |
| 2016-01 | -0.07% | -0.36% | -0.36% | 0.84% | 40 | 14/40 | WMT (+0.29%) |
| 2015-12 | -0.57% | -2.34% | -1.16% | 1.02% | 49 | 13/49 | MCD (+0.06%) |
| 2015-11 | -0.10% | -0.44% | -0.10% | 1.48% | 83 | 30/83 | NFLX (+0.11%) |
| 2015-10 | +2.36% | +9.42% | +51.74% | 0.54% | 33 | 28/33 | MSFT (+3.80%) |
| 2015-09 | -0.11% | -0.48% | -3.92% | 0.12% | 4 | 0/4 | AAPL (+0.00%) |
| 2015-08 | -1.87% | -7.50% | -1.87% | 1.88% | 62 | 0/62 | AAPL (+0.00%) |
| 2015-07 | +0.97% | +3.86% | +1.94% | 0.44% | 32 | 18/32 | AMZN (+0.44%) |
| 2015-06 | -0.40% | -1.63% | -0.40% | 1.29% | 64 | 18/64 | MET (+0.06%) |
| 2015-05 | +0.40% | +1.57% | +0.79% | 0.74% | 48 | 24/48 | GILD (+0.20%) |
| 2015-04 | +0.05% | +0.17% | +0.17% | 0.45% | 28 | 6/28 | LYB (+0.64%) |
| 2015-03 | -0.70% | -2.83% | -0.70% | 1.40% | 82 | 18/82 | TGT (+0.06%) |
| 2015-02 | +4.31% | +17.20% | +4.31% | 1.32% | 90 | 77/90 | CRM (+0.21%) |
Showing 133 of 133 months.
Key Risks
Premium Decay
Theta works against long options. In low-momentum, trending-sideways markets, premiums erode month after month with no payoff.
Vol Regime Shifts
Periods of realised vol compression raise premium cost relative to payoff, reducing expected edge. Backtest before Sep 2020 is VIX-scaled but future regimes are unknown.
Momentum Crowding
Short-term momentum is a well-known factor. As capital crowds the trade the edge compresses. Signal decay is a permanent risk for any systematic momentum strategy.
Execution Slippage
Up to ~95 concurrent options positions (median ~60). Bid-ask spreads and market impact are not modelled and would reduce real-world returns materially.
Parameters
| Universe | Top-100 SPX members by market cap (point-in-time) |
| Signal | Prior-month return > 0 (1M momentum) |
| Instrument | 1-month ATM call options |
| Sizing | Equal weight; uniform 1× sizing |
| Rebalance | Monthly (first trading day) |
| Target DTE | 30 days |
| Premium source (post-Sep-2020) | Live S3 options data |
| Premium source (pre-Sep-2020) | Proxy model, VIX-scaled to Sep 2020 anchor |
| VIX anchor | 26.37 (Sep 2020) |
| Backtest window | Feb 2015 – Feb 2026 (133 months) |
Not investment advice. Figures above are from a historical backtest and do not guarantee future results. Options premiums are volatile; the strategy can lose its entire premium budget in consecutive down months. Bid-ask spreads and market impact are not modelled.